Key Border Indicators
U.S.-Mexico Border Region by the Numbers


Population
26
millon
MX border,
19,295,177
U.S. border
7,129,653
The U.S.-Mexico border is one of the most dynamic regions in the world with more than 26 million people living and working in urban centers, binational metropolitan areas and rural communities within the NADBank jurisdiction. Approximately 7.1 million are living on the U.S. side of the border and 19.3 million on the Mexico side.
U.S.-Mexico Border Population within in NADBank Jurisdiction (2020)
| U.S. | 7.1 millon | Counties |
|---|---|---|
| Arizona | 1,098,874 | 6 |
| California | 3,433,549 | 3 |
| New Mexico | 208,247 | 5 |
| Texas | 2,388,983 | 27 |
| See details | ||
| Mexico | 19.3 million | Municipalities |
|---|---|---|
| Baja California | 3,764,221 | 6 |
| Chihuahua | 3,352,370 | 46 |
| Coahuila | 2,086,069 | 35 |
| Nuevo Leon | 5,745,773 | 50 |
| Sonora | 1,893,122 | 57 |
| Tamaulipas | 2,453,622 | 30 |
| See details | ||
A Dynamic Economy
The U.S.-Mexico border economy reached US$1.5 trillion in 2023 and continues to demonstrate a rapid pace of economic growth and recovery since 2020.
Real GDP (U.S.-MEX Border)
(Trillion USD; unless otherwise indicated)1

In 2023, the U.S. border—41 counties that are part of NADBank jurisdiction—accounted for 57% of the real GDP of the region, driven by the size of San Diego County, CA and Maricopa County, AZ.
Real GDP of the Mexico - US Border, 20232
1.5
trillion
USD (2023)
57%
U.S. Border
43%
MEX Border
Real GDP U.S.-Mexico Border by state, 20233
| Real GDP (million USD) | |
|---|---|
| U.S. | |
| AZ | |
| CA | |
| NM | |
| TX | |
| U.S. border | |
| 2018 | 2019 | 2020 | 2021 | 2022 | 2023 | ||||||||||||||||||||||||||||||
|---|---|---|---|---|---|---|---|---|---|---|---|---|---|---|---|---|---|---|---|---|---|---|---|---|---|---|---|---|---|---|---|---|---|---|---|
|
|
|
|
|
|
| Real GDP (million MXN) | |
|---|---|
| MEX | |
| BC | |
| CH | |
| CO | |
| NL | |
| SO | |
| TA | |
| MEX border | |
| 2018 | 2019 | 2020 | 2021 | 2022 | 2023 | ||||||||||||||||||||||||||||||||||||||||||
|---|---|---|---|---|---|---|---|---|---|---|---|---|---|---|---|---|---|---|---|---|---|---|---|---|---|---|---|---|---|---|---|---|---|---|---|---|---|---|---|---|---|---|---|---|---|---|---|
|
|
|
|
|
|
In recent years, the U.S. border region has been growing at a faster rate than the nation, reflecting a rapidly expanding and resilient economy.
REAL GDP GROWTH (ANNUAL PERCENT CHANGE)4
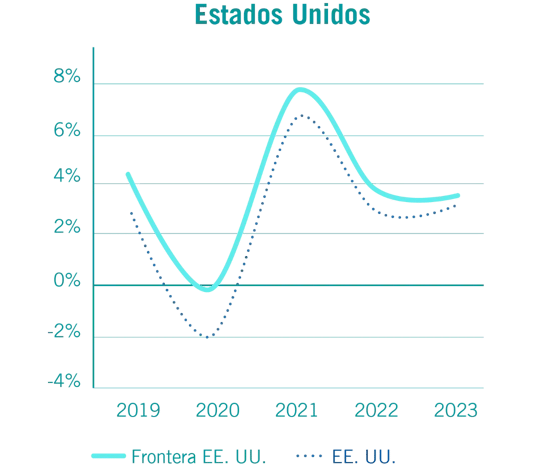
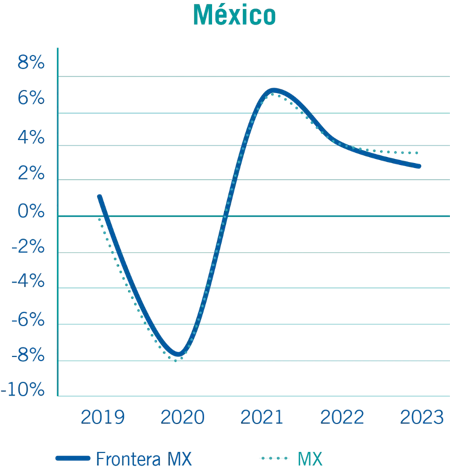
Economic growth in the border has shown uneven patterns in recent years with some counties or states outpacing the border average due to sectoral strengths, investment dynamism, and population expansion. 5

Cross-Border Trade
Bilateral trade between the U.S. and Mexico reached an estimated US$840 billion in 2024, creating millions of jobs in both countries, which are supporting commercial trade, boosting local economies, strengthening supply chain resilience and advancing regional development.
$839,892
millons USD
Exports to MX
$334,041
Imports from MX
$505,581
Source: Developed by NADBank with data from: the Federal Reserve Bank of St. Louis.
U.S.-Mexico Bilateral Trade of Goods (2024)
In 2024, approximately US$1.6 million in goods crossed the U.S.-Mexico border every minute through vital land ports that enable social, economic and logistical integration between the two countries.
1 Source: NADBank calculations based on data from U.S. Bureau of Economic Analysis, INEGI and World Bank. Note: Data for U.S. border refers to the real GDP of the 41 counties within the NADBank jurisdiction. Data for Mexico refers to the real GDP at the state level for the six border states, converted to USD using purchasing power parity (PPP) conversion factors.
2 Source: NADBank calculations based on data from the U.S. Bureau of Economic Analysis, INEGI and World Bank. Note: Data for U.S. border refers to the real GDP of the 41 counties within the NADBank jurisdiction. Data for Mexico refers to the real GDP at the state level for the six border states, converted to USD using purchasing power parity (PPP) conversion factors.
3 Source: NADBank calculations based on data from U.S. Bureau of Economic Analysis, INEGI and Federal Reserve Economic Data. Note: Data for U.S. border refers to the real GDP of the 41 counties within the NADBank jurisdiction. Data for Mexico border refers to the real GDP at the state level for the six border states.
4Source: NADBank calculations based on local currency values; U.S. Bureau of Economic Analysis, INEGI. Note: Data for U.S. border refers to the real GDP of the 41 counties within the NADBank jurisdiction. Data for Mexico border refers to the real GDP at the state level for the six border states. Growth rates are calculated using local currency values. .
5 Source: NADBank calculations based on data from U.S. Bureau of Economic Analysis, INEGI and World Bank. Note: Data for U.S. border refers to the real GDP of the 41 counties within NADBank jurisdiction. Data for Mexico refers to the real GDP at the state level for the six border states, converted to USD using purchasing power parity conversion factors.
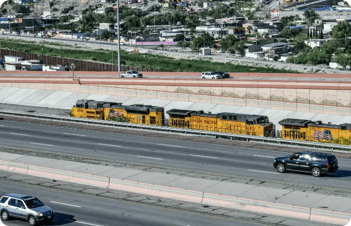
U.S.-Mexico Ports of Entry
Around 8 million cargo trucks moving goods for supply value chains and to meet end-customer needs in the U.S. and Mexico crossed the border in 2024.
Aside from cargo to boost international trade, the movement of people and personal vehicles between the two countries reflects the deep economic, social and cultural ties in the border region, with about 77 million personal vehicles and 41 million people crossing the border in 2024.
Image description: Cross-border mobility continues to evolve, with legitimate trade and travel showing significant long-term growth since 1996.

Border Crossings by Type in 2024

Trucks
7,617,207
+134%
Var. % 96´ vs 24´

Pedestrians
40,769,064
+20%
Var. % 96´ vs 24´

Personal Veh. Passengers
138,370,646
-19%
Var. % 96´ vs 24´

Personal Vehicles
76,884,566
+23%
Var. % 96´ vs 24´
Source: Developed by NADBank with data from the U.S. Bureau of Transportation Statistics (BTS)
Laredo, TX—the largest international port in the United States—facilitated the crossing of US$331 billion in total trade last year (40% of total trade).
Transboundary Basins
Three transboundary water basins span the U.S.-Mexico border, supporting urban and rural communities, as well as agricultural and industrial hubs and energy generation. These transboundary basins are governed by compacts, treaties and minutes established between the two nations and across states. The map illustrates the distribution of these three basins along the border.

Since the U.S.-Mexico border region is prone to droughts, water stress creates challenges and opportunities for the sustainable use and management of water resources between the two countries.

A Riverine Border
The boundary between the two countries is mainly defined by natural waterways—primarily the Rio Grande and a small section of the Colorado River. An estimated 1,242 miles of the roughly 1,926-mile border is delineated by these two rivers. Official data from the International Boundary and Water Commission (IBWC) confirm this little-remarked fact: the border basically follows the course of the rivers. Despite the irregular flow of the Rio Grande in certain areas caused by overuse, water management challenges and climate stress, this river remains an official international boundary, emphasizing the natural link between geography and political borders.

Water Storage Capacity
Some of the most critical reservoirs on the U.S.-Mexico border are currently at low levels due to changes in the water cycle that have altered precipitation patterns. Critical water shortages are occurring in the states of Sonora and Chihuahua, where most reservoirs are operating at less than 25% of their capacity.
Note: In the case of the International Amistad and Falcon Reservoirs, storage capacity and actual storage represent the sum of both countries. Each pie chart represents the storage capacity of the dam, and the blue portion of each chart indicates the percentage of water available.